
Let’s face it, economists are big fans of curves: supply and demand curves, marginal cost curves, and the Phillips curve (RIP) to name a few. Even if economists draw it as a straight line, they will still refer to them as curves. Economists love to play around with curves—shift them, extended them, and change the slope of them. You name it, and I can bet you that economist has fantasized about. And it makes sense because curves in economics are vital, as they help us visualize concepts like the law of demand, economies of scale and the trade-off between unemployment and inflation (at least it used to). However, we often use these curves in economics to explain concepts, and things that have happened in the past, rather than using them to predict cash flows, appreciation, worth, value, income, profits, and job growth.
In fact, once governments started using the Phillips curve to predict how inflation and unemployment would affect one another the relationship fell apart. What’s crazy is that the data for the original Phillips curve ranged from 1861 to 1958. With almost 100 years of data relationship held true. So is there a curve that exists today that can predict shifts in the economy?
In short, there is a magical and predictive curve—the yield curve. If you've taken micro or macro and haven't heard of the yield curve don't worry. It isn't usually taught or explicitly mentioned in an intro macroeconomics because it's more closely connected to the financial sector than it is to the macroeconomy. But if you've talked about how the Fed changes interest rates, then you're already off to a great start.
The yield curve essentially shows the yield or interest rate on different maturity bonds at a specific period of time. The most widely looked at yield curve is that of US Treasury bills, notes, and bonds. For definition purposes Treasury bills are issued with a maturity date or less than one year, notes last from one to ten years and bonds are the longest maturity fixed income instrument and can last from ten to thirty years. There also exists bonds that never end, these are called perpetual bonds—or perps—we won’t be looking at these as they act more as equities than debt.
On the x-axis, we have the different maturity lengths, for example, one month, three months, one year, ten years, et cetera. On the y-axis, we have the yield (technically it’s the APR, but we won’t get too deep into that for now) in percent, which as mentioned earlier is the interest rate paid to the owner of the instrument. Generally, the curve—or the connection between these points—is upward sloping. This isn’t always the case, but we’ll get into that in a minute.
At the far left is one of our most important maturity dates, the three month bill. When we talk about the Fed changing short-term interest rates, this is the Treasury bill the Fed is directly interacting with. When the Fed wants to lower interest rates, they'll go into the market and buy these three month Treasury bills. By doing so, the Fed injects cash into the economy, increasing the money supply. However, what we care about is what this does to the price of the bill.
Remember basic supply and demand? If the Fed buys bonds, this will put upward pressure on the price of the bills as each time the Fed buys one, they become scarcer. It’s important to remember that the price of a bond and its yield are inversely related to one another (this is best understood as a teeter-totter, whereas one goes up, the other goes down). So the yield we see all the way to the left is a direct result of the Fed and its open market operations?
What about the right-hand side of the yield curve? The left-hand side of the curve is much more subject to certainty. Today, we have fairly good idea of what the world's going to look like in three months' time. But how about ten, fifteen or thirty years out? Will Apple still be around in 2047? Who knows! And the magnitude of the yield depends on these uncertainties about the future: interest rate forecasts, GDP growth estimations, and inflation being perhaps the most important (as inflation erodes the purchasing power of a bond). Therefore, because there is typically greater uncertainty in the long-run we typically see a higher yield on bonds with longer durations. This higher yield is to offset the added risks of these uncertainties.
If you recall, I said that the yield curve for US Treasury securities is generally upward sloping, as risk increases. The key word is "generally," and this is where our predictive curve comes into play. On occasions, the yield curve does this really unique thing where it inverts, and the yield on short-term instruments is actually greater than that of the long-term instruments. So instead of getting our standard upward sloping curve, we get a downward sloping curve—a negative yield curve.
How is this possible? Let's remember that in the long-run the yield curve is subject to expectations of investors and that the Fed typically cuts interest rates in anticipation of a downward move in the economy. Due to this anticipation, investors brush aside factors like inflation and move into long-term bonds. If 30-year bonds are in high demand, lenders will offer a higher price and lower yield. This puts downward pressure on the yield of the 30-year, and in turn, makes it less than that of the three-month bill.
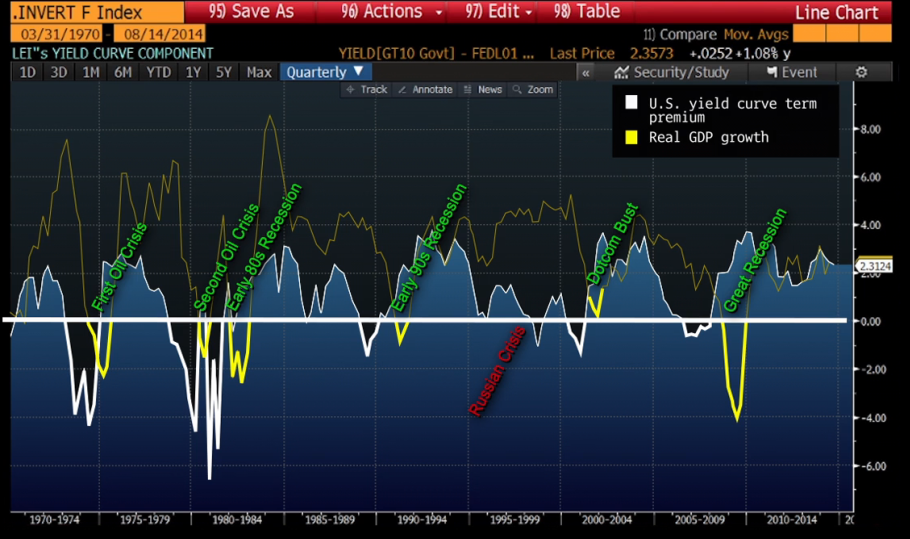
So why’s this important? Well, this inversion has predicted the past six out of seven recessions since 1970. If we look at the graph below, we’ll notice that the yield curve has gone negative right before a decrease in real GDP. The only false positive was before the Russian Rubble Crisis.
So it seems like it has a lot of merits, but if you’re skeptical about the power of the inverted yield you’re not alone. In 2006 Capital Advisors Group published an investment research piece on the 2006 inversion of the yield curve. They wrote: “the yield curve inversion we are experiencing is quite benign. Therefore, there need not be profound concerns that an economic recession will automatically derive from this phenomenon.” Ironically, we can all remember what followed 2006, and it was definitely not benign.
Even the most benign inversion of the yield curve can still give us a lot of insight into the future, and that might be why the St. Louis Fed uses it in their calculation of their Financial Stress Test Index. As the Fed continues to raise rates, the yield curve might become one of the hottest curves of 2017
Sources:
Bloomberg Market Concepts Yield Curves, n.d.
Estrella, Arturo, and Frederic Mishkin. “The Yield Curve as a Predictor of U.S. Recessions.” Current Issue in Economics and Finance 2, no. 7 (June 1996). https://www.newyorkfed.org/medialibrary/media/research/current_issues/ci2-7.pdf.
Federal Reserve Bank of St. Louis. “St. Louis Fed Financial Stress Index©.” FRED, Federal Reserve Bank of St. Louis, December 31, 1993. https://fred.stlouisfed.org/series/STLFSI.
Kenny, Thomas. “Why Do Bond Prices and Yields Move in Opposite Directions?” The Balance. Accessed September 14, 2017. https://www.thebalance.com/why-do-bond-prices-and-yields-move-in-opposite-directions-417082.
Pan, Lance. “The Inverted Yield Curve: Historical Perspectives and Implications on Cash Portfolios.” Capital Advisors, 2006.
Smith, Lisa. “Perpetual Bonds: An Overview.” Investopedia, August 23, 2013. http://www.investopedia.com/articles/investing/082313/perpetual-bonds-overview.asp.
“The Relationship Between Inflation and Unemployment | Boundless Economics.” Accessed September 14, 2017. https://courses.lumenlearning.com/boundless-economics/chapter/the-relationship-between-inflation-and-unemployment/.
“What Is a Yield Curve? - Fidelity.” Accessed September 14, 2017. https://www.fidelity.com/learning-center/investment-products/fixed-income-bonds/bond-yield-curve.